作者:宣泽春,新炬网络高级技术专家。
1.为什么要生成曲线图
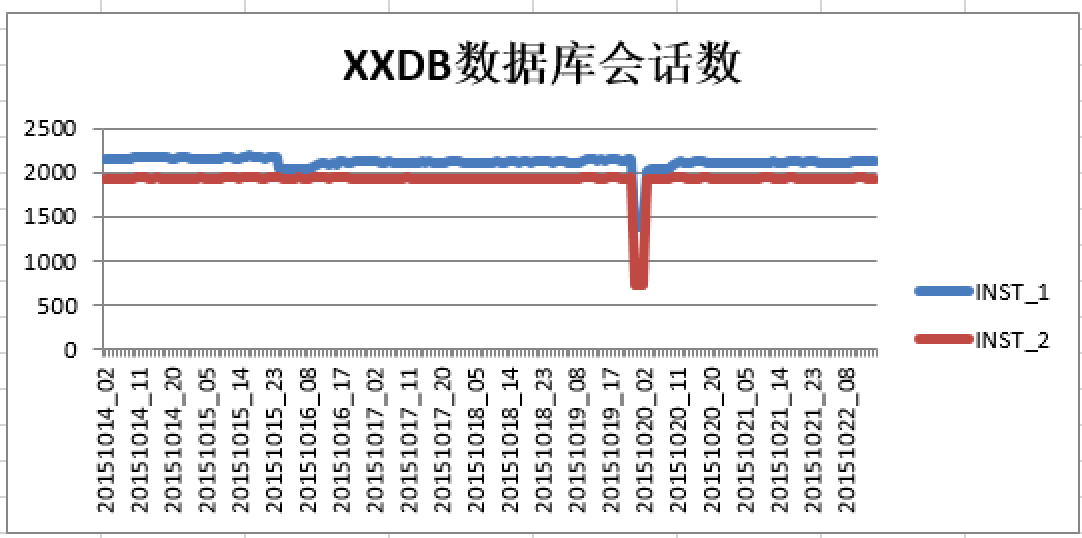
做oracle数据库运维,有时会经常要看一周内数据库运行的情况,而通过性能曲线图最能展现数据库系统的性能变化情况了。如果有安装oracle的EM,看这个也不是问题。但有些数据库是没安装的,而且EM的是较难以实现定制化的报表需求的,难以把图表发给用户。
先来看一下要生成的数据效果图:
还有些附加的要求,如生成报表的工具需要在UNIX/LINUX下执行,能一键直接生成exel报表,可以方便地插入到word中。
本文正是如何使用python实现这一过程的,主要面向oracle dba且对编程语言有一定了解的读者。
2.为什么要使用python
如果说到为什么要使用python,只要稍微了解一下自动化运维,就会明白python是这一领域编程的王者。业界最有名的自动化运维工具SaltStack及ansible都是基于python实现的。
3.如何做到
接下讲在已经安装好oracle数据库11g DB的Linux环境下,如何一步一步实现最终目标。
3.1.安装python
在大部份linux及unix下本身会自带python环境,但版本可能过旧,可能会导致后面使用到的一些包不兼容,因此建议进行新安装。安装时可以考虑使用root账号进行安装,如果没有root权限,使用主机账号oracle也可以进行安装。
Python的版本选择了最新的2.7.10版本,未选3.5主要原因是考虑到3.x下的软件包还不如2.x下丰富。
以oracle账号安装python示例:
推荐使用源代码方式进行安装,主要的是从 http://www.python.org/ftp/python/下载 Python 的源代码。选择最新的版本,下载.tgz 文件,执行通常的 configure, make, make install 步骤。
参考如下:
本文设定的python主安装目录为/home/oracle/opt/python2.7.10/
切换至oracle用户并创建安装目录
su - oracle
[oracle@ocm ~]$ mkdir -p /home/oracle/opt/python2.7.10/
设置python环境变量
[oracle@ocm ~]$ vi ~/.bash_profile
在PATH一行加入python路径
PATH=/home/oracle/opt/python2.7.10/bin:/usr/sbin:/sbin:/usr/bin:$PATH:$HOME/bin:
export PATH
下载安装包
[oracle@ocm ~]$ wget https://www.python.org/ftp/python/2.7.10/Python-2.7.10.tgz --no-check-certificate
--2015-10-25 12:41:56-- https://www.python.org/ftp/python/2.7.10/Python-2.7.10.tgz
Resolving www.python.org... 103.245.222.223
Connecting to www.python.org|103.245.222.223|:443... connected.
WARNING: cannot verify www.python.org's certificate, issued by `/C=US/O=DigiCert Inc/OU=www.digicert.com/CN=DigiCert SHA2 Extended Validation Server CA':
Unable to locally verify the issuer's authority.
HTTP request sent, awaiting response... 200 OK
Length: 16768806 (16M) [application/octet-stream]
...
解压安装包并进入目录
[oracle@ocm Python-2.7.10]$ tar xfz Python-2.7.10.tgz
[oracle@ocm Python-2.7.10]$ cd Python-2.7.10
执行configure命令
[oracle@ocm Python-2.7.10]$./configure --prefix=/home/oracle/opt/python2.7.10/
checking build system type... i686-pc-linux-gnu
checking host system type... i686-pc-linux-gnu
checking for --enable-universalsdk... no
checking for --with-universal-archs... 32-bit
....
config.status: pyconfig.h is unchanged
creating Modules/Setup
creating Modules/Setup.local
creating Makefile
执行make命令
[oracle@ocm Python-2.7.10]$ make
...
执行make install命令
[oracle@ocm Python-2.7.10]$ make install
...
验证python
[oracle@ocm Python-2.7.10]$ python
Python 2.7.10 (default, Oct 25 2015, 13:07:20)
[GCC 4.1.2 20080704 (Red Hat 4.1.2-46)] on linux2
Type "help", "copyright", "credits" or "license" for more information.
>>>
到此python的2.7.10 for linux已安装完成
3.2. 安装cx_Oracle模块
安装cx_Oracle的主要目的是使python能连接oracle数据库,用于获取数据库中的会话记录
前提条件为
oracle数据库软件或客户端已经安装好,版本10g以上,关键环境变量ORACLE_HOME, LD_LIBRARY_PATH已正确配置
本文的关键设置如下:
vi ~/.bash_profile
export ORACLE_BASE=/u01/app/oracle
export ORACLE_HOME=$ORACLE_BASE/product/11.2.0/dbhome_1
export LD_LIBRARY_PATH=$ORACLE_HOME/lib
刷新环境变量
source ~/.bash_profile
python 版本建议是2.6以上
cx_Oracle的下载地址为https://pypi.python.org/pypi/cx_Oracle/#downloads,到本文截止时最的安装包为cx_Oracle-5.2.tar.gz
安装及测试过程如下:
下载
wget https://pypi.python.org/packages/source/c/cx_Oracle/cx_Oracle-5.2.tar.gz#md5=6a49e1aa0e5b48589f8edfe5884ff5a5 --no-check-certificate
解压
gunzip cx_Oracle-5.2.tar.gz
tar xvf cx_Oracle-5.2.tar
执行安装
cd cx_Oracle-5.2
python setup.py install
测试cx_Oracle模块是否正常
>>> import cx_Oracle
>>>
如出现以下ImportError提示,表示数据库软件未正常安装或关键环境变更设置不正确
>>> import cx_Oracle
Traceback (most recent call last):
File "", line 1, in
ImportError: libclntsh.so.11.1: cannot open shared object file: No such file or directory
测试使用python连接oracle数据库
vi test_cx_oracle.py
# -*- coding:UTF-8 -*-
import cx_Oracle #引用模块cx_Oracle
conn=cx_Oracle.connect('scott/tiger@127.0.0.1:1521/orcl') #连接数据库,格式为:用户名/密码@IP:端口/服务名
c=conn.cursor() #获取cursor
x=c.execute('select * from scott.emp') #使用cursor进行各种操作
print x.fetchone() #打印一行
row = x.fetchall()
for r in row: #循环打印所有行
print r
c.close() #关闭cursor
conn.close() #关闭连接
执行测试脚本
python test_cx_oracle.py
出现类似如下结果,表明python已正常连接数据库,并成功获取数据,打印出来
[oracle@ocm ~]$ python test_cx_oracle.py
(7369, 'SMITH', 'CLERK', 7902, datetime.datetime(1980, 12, 17, 0, 0), 800.0, None, 20)
(7499, 'ALLEN', 'SALESMAN', 7698, datetime.datetime(1981, 2, 20, 0, 0), 1600.0, 300.0, 30)
(7521, 'WARD', 'SALESMAN', 7698, datetime.datetime(1981, 2, 22, 0, 0), 1250.0, 500.0, 30)
(7566, 'JONES', 'MANAGER', 7839, datetime.datetime(1981, 4, 2, 0, 0), 2975.0, None, 20)
(7654, 'MARTIN', 'SALESMAN', 7698, datetime.datetime(1981, 9, 28, 0, 0), 1250.0, 1400.0, 30)
(7698, 'BLAKE', 'MANAGER', 7839, datetime.datetime(1981, 5, 1, 0, 0), 2850.0, None, 30)
(7782, 'CLARK', 'MANAGER', 7839, datetime.datetime(1981, 6, 9, 0, 0), 2450.0, None, 10)
(7788, 'SCOTT', 'ANALYST', 7566, datetime.datetime(1987, 4, 19, 0, 0), 3000.0, None, 20)
(7839, 'KING', 'PRESIDENT', None, datetime.datetime(1981, 11, 17, 0, 0), 5000.0, None, 10)
(7844, 'TURNER', 'SALESMAN', 7698, datetime.datetime(1981, 9, 8, 0, 0), 1500.0, 0.0, 30)
(7876, 'ADAMS', 'CLERK', 7788, datetime.datetime(1987, 5, 23, 0, 0), 1100.0, None, 20)
(7900, 'JAMES', 'CLERK', 7698, datetime.datetime(1981, 12, 3, 0, 0), 950.0, None, 30)
(7902, 'FORD', 'ANALYST', 7566, datetime.datetime(1981, 12, 3, 0, 0), 3000.0, None, 20)
(7934, 'MILLER', 'CLERK', 7782, datetime.datetime(1982, 1, 23, 0, 0), 1300.0, None, 10)
到此,连接oracle的cx_Oracle模块安装测试完成
3.3. 安装xlsxwriter模块
为什么要安装xlsxwirter模块呢,主要是用来以python方式读写xlsx文件,也就是excel文件,并操作excel生成图表
以下为安装及测试过程
下载地址:https://pypi.python.org/pypi/XlsxWriter#downloads
下载
wget https://pypi.python.org/packages/source/X/XlsxWriter/XlsxWriter-0.7.7.tar.gz#md5=c68dca16927e2a919837c68ff63b1e5b --no-check-certificate
解压
gunzip XlsxWriter-0.7.7.tar.gz
tar xvf XlsxWriter-0.7.7.tar
执行安装
cd XlsxWriter-0.7.7
python setup.py install
测试xlsxwriter模块是否正常
>>> import xlsxwriter
>>>
测试写xlsx文件
vi test_xlsx.py
# -*- coding:UTF-8 -*-
import xlsxwriter
workbook = xlsxwriter.Workbook('hello.xlsx')
worksheet = workbook.add_worksheet()
worksheet.write('A1', 'Hello world')
workbook.close()
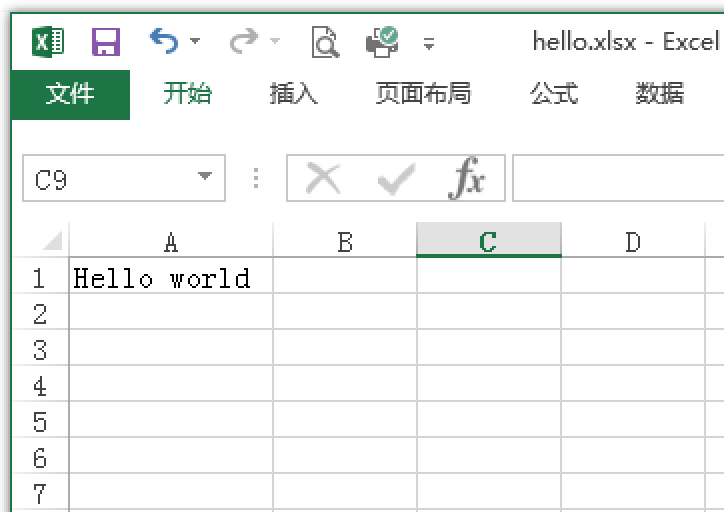
下载生成的文件hello.xlsx,用excel打开可以看到,生成结果如下:
从上图可以看到,已在A1单元格正确写入Hello world。
到此,xlsxwriter模块安装完成。
3.4. 编写一键生成脚本
数据从何而来?
要生成曲线图,总有得有数据。
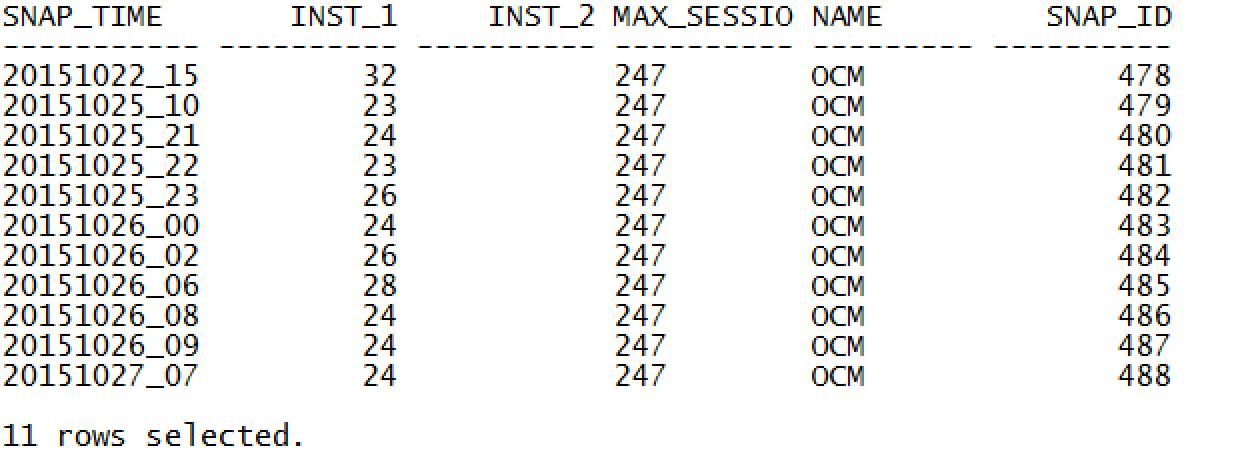
通过以下语句便可以查询oracle数据库AWR报告中会话变化情况数据(事先给相应账号授权,如:grant select any dictionary to scott):
SELECT
to_char(trunc(b.end_interval_time+10/60/24,'hh24'),'yyyymmdd_hh24') snap_time,
sum(decode(a.instance_number, 1, a.value)) "INST_1",
sum(decode(a.instance_number, 2, a.value)) "INST_2",
c.value max_session,
d.name ,a.snap_id
FROM DBA_HIST_SYSSTAT a, dba_hist_snapshot b, (select value from v$parameter where name='sessions') c,v$database d
WHERE a.SNAP_ID = b.snap_id
AND a.instance_number = b.instance_number
AND STAT_NAME = 'logons current'
GROUP BY d.name,a.snap_id, c.value, to_char(trunc(b.end_interval_time+10/60/24,'hh24'),'yyyymmdd_hh24')
order by snap_id;
上图中的INST_2没有数据,是因为本次连接的数据库为单实例数据库,所以数据为空。
打开xlsxwriter官方网站,http://xlsxwriter.readthedocs.org/,看看是如何生成excel曲线图的。
在首页找到Chart Examples,再进入Example: Line Chart页面。
http://xlsxwriter.readthedocs.org/example_chart_line.html
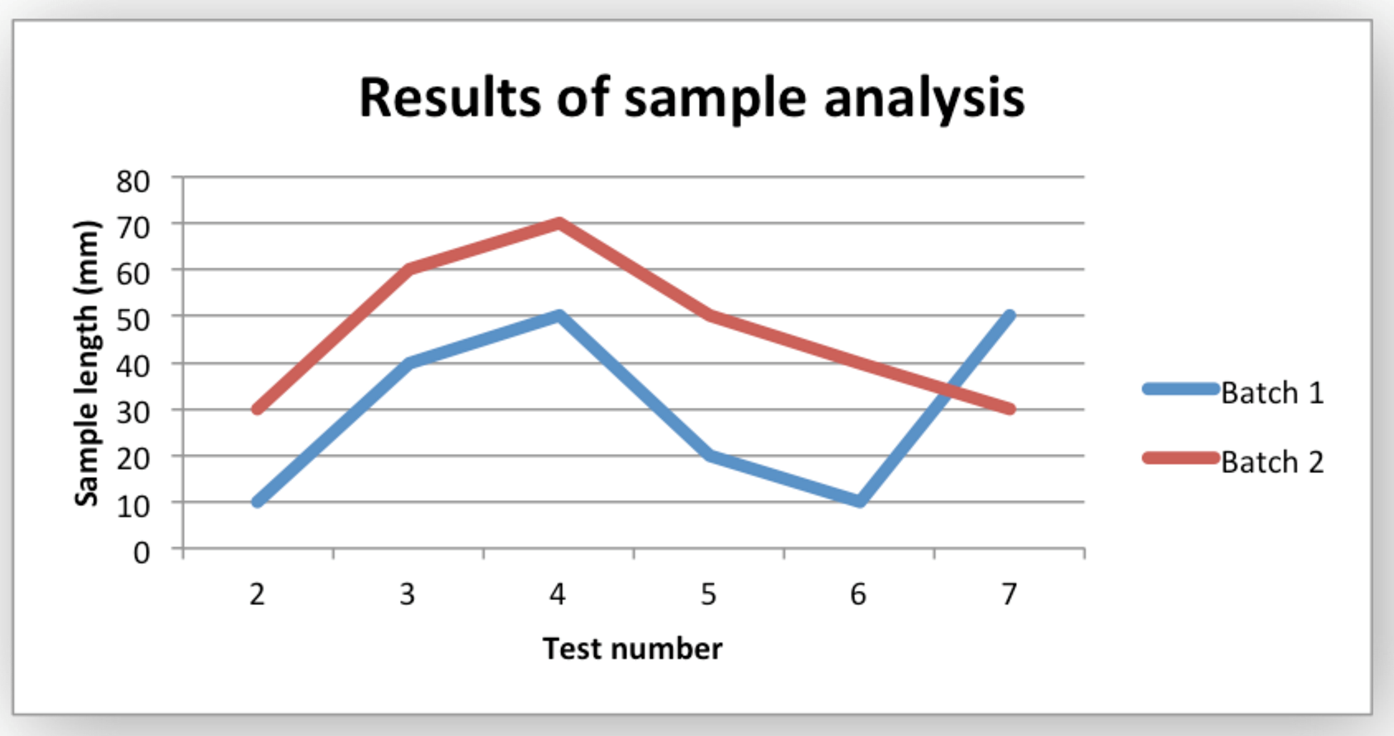
以下的官方给出的例子:
#######################################################################
#
# An example of creating Excel Line charts with Python and XlsxWriter.
#
# Copyright 2013-2015, John McNamara, jmcnamara@cpan.org
#
import xlsxwriter
workbook = xlsxwriter.Workbook('chart_line.xlsx')
worksheet = workbook.add_worksheet()
bold = workbook.add_format({'bold': 1})
# Add the worksheet data that the charts will refer to.
headings = ['Number', 'Batch 1', 'Batch 2']
data = [
[2, 3, 4, 5, 6, 7],
[10, 40, 50, 20, 10, 50],
[30, 60, 70, 50, 40, 30],
]
worksheet.write_row('A1', headings, bold)
worksheet.write_column('A2', data[0])
worksheet.write_column('B2', data[1])
worksheet.write_column('C2', data[2])
# Create a new chart object. In this case an embedded chart.
chart1 = workbook.add_chart({'type': 'line'})
# Configure the first series.
chart1.add_series({
'name': '=Sheet1!$B$1',
'categories': '=Sheet1!$A$2:$A$7',
'values': '=Sheet1!$B$2:$B$7',
})
# Configure second series. Note use of alternative syntax to define ranges.
chart1.add_series({
'name': ['Sheet1', 0, 2],
'categories': ['Sheet1', 1, 0, 6, 0],
'values': ['Sheet1', 1, 2, 6, 2],
})
# Add a chart title and some axis labels.
chart1.set_title ({'name': 'Results of sample analysis'})
chart1.set_x_axis({'name': 'Test number'})
chart1.set_y_axis({'name': 'Sample length (mm)'})
# Set an Excel chart style. Colors with white outline and shadow.
chart1.set_style(10)
# Insert the chart into the worksheet (with an offset).
worksheet.insert_chart('D2', chart1, {'x_offset': 25, 'y_offset': 10})
workbook.close()
结合cx_Oracle的模块部分代码,再稍作修改,便可得出以下代码:
# -*- coding:UTF-8 -*-
#######################################################################
#
# An example of creating Excel Line charts with Python and XlsxWriter.
#
# Copyright 2013-2015, John McNamara, jmcnamara@cpan.org
#
import xlsxwriter, cx_Oracle, sys
reload(sys)
sys.setdefaultencoding('utf-8')
conn = cx_Oracle.connect('scott/tiger@127.0.0.1:1521/orcl) # 连接数据库
c = conn.cursor() # 获取cursor
x = c.execute('''
SELECT
to_char(trunc(b.end_interval_time+10/60/24,'hh24'),'yyyymmdd_hh24') snap_time,
sum(decode(a.instance_number, 1, a.value)) "INSTANCE_1",
sum(decode(a.instance_number, 2, a.value)) "INSTANCE_2",
c.value max_session,
d.name ,a.snap_id
FROM DBA_HIST_SYSSTAT a, dba_hist_snapshot b, (select value from v$parameter where name='sessions') c,v$database d
WHERE a.SNAP_ID = b.snap_id
AND a.instance_number = b.instance_number
AND STAT_NAME = 'logons current'
GROUP BY d.name,a.snap_id, c.value, to_char(trunc(b.end_interval_time+10/60/24,'hh24'),'yyyymmdd_hh24')
order by snap_id
''')
dbname = x.fetchone()[4]
row = x.fetchall()
workbook = xlsxwriter.Workbook('chart_line.xlsx')
worksheet = workbook.add_worksheet()
bold = workbook.add_format({'bold': 1})
# Add the worksheet data that the charts will refer to.
headings = ['DATE_TIME', 'INST_1', 'INST_2', 'MAXSESS', 'DBNAME', 'SNAP_ID', ]
worksheet.write_row('A1', headings, bold)
# worksheet.write_column('A2', row[0])
i = 0
for r in row:
worksheet.write_row('A' + str(i + 2), row[i])
i = i + 1
# Create a new chart object. In this case an embedded chart.
chart1 = workbook.add_chart({'type': 'line'})
chart1.add_series({
'name': ['Sheet1', 0, 1],
'categories': ['Sheet1', 1, 0, i, 0],
'values': ['Sheet1', 1, 1, i, 1],
})
# Configure second series. Note use of alternative syntax to define ranges.
chart1.add_series({
'name': ['Sheet1', 0, 2],
'categories': ['Sheet1', 1, 0, i, 0],
'values': ['Sheet1', 1, 2, i, 2],
})
# Add a chart title and some axis labels.
chart1.set_title({'name': dbname + '数据库会话数'})
# Set an Excel chart style. Colors with white outline and shadow.
chart1.set_style(10)
# Insert the chart into the worksheet (with an offset).
worksheet.insert_chart('D2', chart1, {'x_offset': 25, 'y_offset': 10})
c.close()
workbook.close()
保存为chart_line.py
执行python chart_line.py
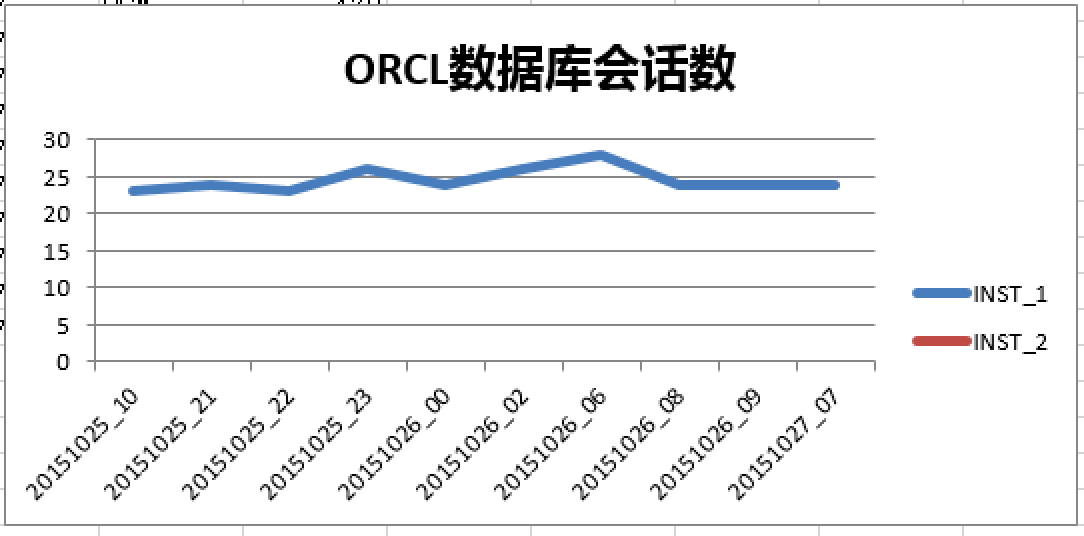
打开生成的excel文件chart_line.xlsx,便可看到生成的如下图表
以上图只有一条线,是因为连接的单实例数据库,如果连接到rac数据库,便可生成两个节点的图表。
4.总结
本文以python的方式从无到有实现的python连接oracle数据库,一键式生成excel图表,仅供各位运维的同学参考,有很多不完善的地方,还请多多包涵,如有需要可自行扩充。
当然,以java或其他方式也可以实现,但Python的简单易用,以很少的代码量,让我们很容易就实现了自己想要的功能。毕竟,人生有很多选择,选择一种自己喜欢的过吧。
至于个人是如何想这样做的呢,主要是参考了刘天斯的《Python自动化运维:技术与最佳实践》,一步步百度、GOOGLE而来的。